cell cinema
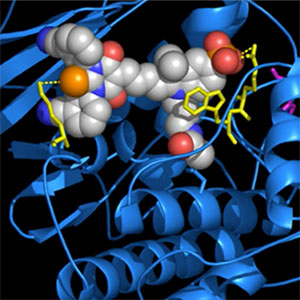
Engineered allosteric control of protein activity - Loopology and RapR approaches for optogenetic and chemogenetic control
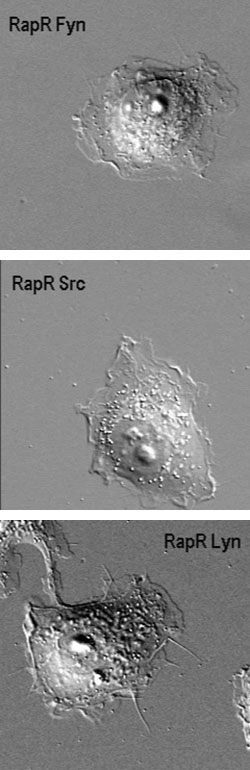
RapR analogs of Src family kinases enable specific activation of closely related family members (Fyn, Src, and Lyn). Each produces a distinct phenotype.
These 3 videos show:
Top - Fyn (spreading)
Middle - Src (spreading followed by movement)
Bottom - Lyn (suprising kinked extensions)
Video by Pei Hsuan Chu
PNAS, 111(34):12420-25, 2014
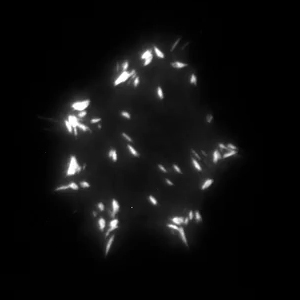
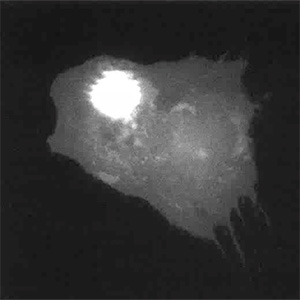
Activation of RapR-Src generates cell spreading, accompanied by adhesion dynamics
Video by Andrei Karginov
Nature Chem Biol, 10(4):286-90, 2014
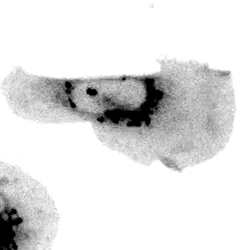
Loopology: Upon photo-inhibition, Src translates to focal adhesions and induces polarized movement.
Video by Onur Dagliyan
Science, 354(6318):1441-1444, 2016

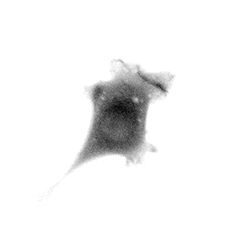
Loopology: Photo-inhibition of Vav2 produces reversible contraction
Video by Onur Dagliyan
Science, 354(6318):1441-1444, 2016
Loopology: Combined photo-activation (PA-Vav2) and photo-inhibition (PI-Rac1) in the same cell
Video by Onur Dagliyan
Science, 354(6318):1441-1444, 2016
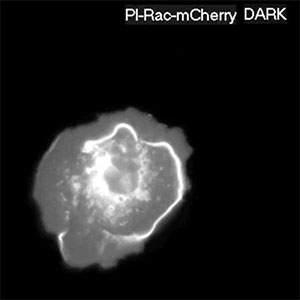
Loopology: Rac1 photo-inhibition. Irradiation induces rapid ruffling followed by cessation of ruffling.
Video by Onur Dagliyan
Science, 13:755-758, 2016

Loopology: Vav2 photo-inhibition. Reversible inhibition of Vav2 produces blebbing.
Video by Onur Dagliyan
Science, 13:755-758, 2016
PA-Rac1
PA-Rac: Moving laser spot induces Rac1 activation, generating localized protrusion
Video by Yi Wu
Nature, 46:104-110, 2009

PA-Rac: Pulses of light on one spot along the cell edge (red circle) activate Rac1 locally, producing first ruffles and then a protrusion
Video by Yi Wu
Nature, 461:104-110, 2009

PA-Rac: HEK293 cell follows a light spot that activates Rac1
Video by Yi Wu
Nature, 461:104-110, 2009
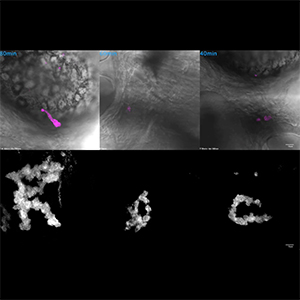
PA-Rac: Fluorescent neutrophils in living zebrafish spelling "Rac"
Video by our collaborators, Sa Kan Yoo and Qing Deng, in the Huttenlocher Lab
Dev. Cell, 18:226-23, 2010
NIGMS Biomedical Beats: "Cool video: Leading Cells with light"
Video captions and narration by NIH, images by Yi Wu
NIGMS Biomedical Beats, Sept, 2009
Lovetrap and miscellaneous optogenetics

LOVTRAP: reversible sequestration of GFP at mitochondria
Video by Hui Wang
Nature Methods, 13:755-758, 2016

LOVTRAP: activation of VaV2 produces cell oscillations
Video by Hui Wang
Nature Methods, 13:755-758, 2016

Optogenetic control of nuclear import. Control of NLS/NES exposure
Video by our collaborators in the Kuhlman Lab
Nature Chem. Biol., 12(6): 399-401, 2016.
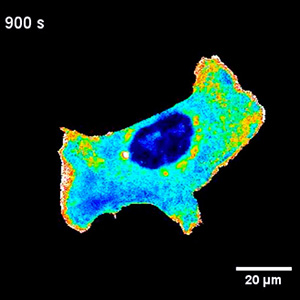
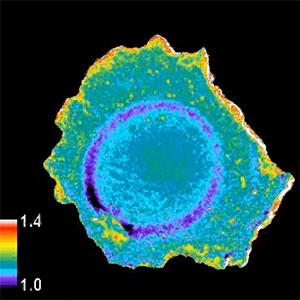
Genetically encoded biosensors

RhoA activation versus localization in a moving fibroblast
Video by Olivier Pertz and Louis Hodgson
Nature, 440:1069-1072, 2006

Rac1 activation in a motile fibroblast
Video by Christopher Welch
Nature, 461:104-110, 2009

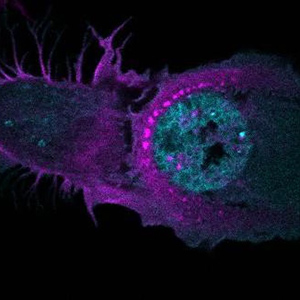
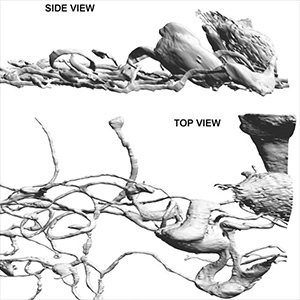
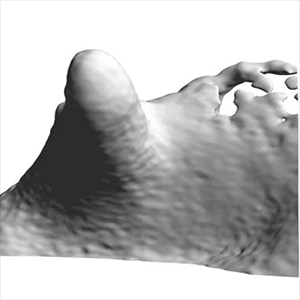
Activation of Rap1 at tips of dorsal ruffles. 3D analysis using ImageTank
Video by Ellen O'Shaughnessy
J. Cell Biol., 218(9):3153-3160, 2019

Rap1 activity bridges ventral ECM interactions and dorsel ruffles.
3D visualization using ImageTank software
Video by Ellen O'Shaughnessy
J. Cell Biol., 218(9):3153-3160, 2019

3D view of Rap1 activation in moving fibroblast using ImageTank
Video by Ellen O'Shaughnessy
J. Cell Biol., 218(9):3153-3160, 2019

GEF-H1 is held in the off state on microtubules and released at microtubule tips for localized activation. Microtubules (L), GEF-H1 activity (R)
Video by Mihai Azoitei
J. Cell Biol., 218 (9):3077–3097, 2019
Multiplexed imaging of GTPases and GEFs
Video by Daniel J. Marston
Nature Chem. Biol., 16(8):826-833,2020.
SPECTR (Small Peptide Exposure for Conformation Tracking)
Conformational changes of individual molecules within living cells. Src molecules turn yellow when in open conformation.
Video by Bei Liu
Cell, 2021:Oct11; doi.org/10.1016/j.cell.2021.09.026
Initially named binder/tag
Making a FRET biosensor using SPECTR. Src activation during cell motility.
Video by Bei Liu
Cell, 2021:Oct11; doi.org/10.1016/j.cell.2021.09.026
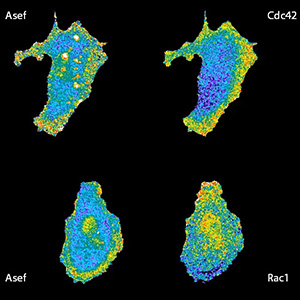
Biosensors based on environment-sensing dyes

Cdc42 activation in RhoA-inhibited cell; meroCBD biosensor
Video by Perihan Nalbant and Louis Hodgson
Science, 305:1615-1619, 2004
Merocyanine dye on phospho-ERK2
Video by Alexei Toutchkine and Brenda Temple
Src activation in macropinocytic vesicles.
Video by Akash Gulyani
Nature Chem Biol, 7(7):437-44, 2011
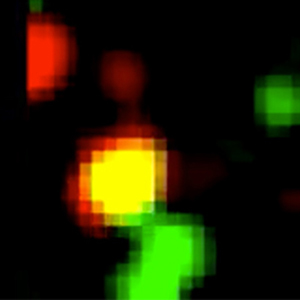
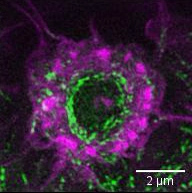
Podosome biology
Macrophage forms a ring of podosomes (purple dots) when contacting a micro patterned circle of substrate antibodies (green).
Video by Takashi Watanbe
Nature Communications, 13:4363, 2022
Microtubule trapped within a ring of podosomes (at approximately 5 oclock)
Video by Shiqiong Hu
Nature Communications, 13:4363, 2022
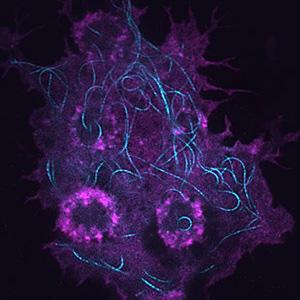
Podosome Structures

Podsome structure and dynamics
3D-SIM projection of F-actin and myosin II in a ring of podosomes
Video by Shiqiong Hu
Nature Communications, 13:4363, 2022.
Cartoon showing protein positions
Proteins (top to bottom):
IgG,
FcγRIIA,
F-actin,
Paxillin,
Talin,
Myosin II
Cartoon by Megan Kern
Nature Communications, 13:4363, 2022.
Image analysis and modeling

Sampling windows track the cell edge - localized assessment of biosensor correlation with cell behavior
Video by our collaborators in the Danuser lab
Nature, 461:99-103, 2009
Automated tracking of cell morphology. Simple 2D trace captures morphodynamics over time
Video by our collaborators in the Elston and Tsygankov labs
PNAS, 111(34):12420–12425, 2014

CellGeo package accurately measures dimensions and morphodynamics of complex cell boundaries
Video by our collaborators in the Elston and Tsygankov labs
J. Cell Biol., 204(3):443-460, 2014

Danuser lab analysis of coordination between GEF-H1 activity and cell protrusion
Video by Mihai Azoitei
J. Cell Biol., 218(9):3077–3097, 2019
Miscellaneous
 Movie 2
Megakaryocyte proplatelet extensions
Videos by Ellen O'Shaughnessy and Ana Nogueria
Lab Chip, 22(1): 136–147, 2021.

Cytotoxic T lymphocyte contacts virally infected fibroblast. This leads to synapse formation, accumulation of cytotoxic granules at the interface, injection of granule contents into the fibroblast, and finally fibroblast apoptosis. (old movie captured using video tape – the good old days)
Video by Klaus Hahn, Robin DeBiasio, Greg LaRocca, D. Lansing Taylor, and Michael Oldstone
Virology, 201(2):330-340, 1994

GFP Vinculin reveals adhesions and dorsal ruffling
Video by Louis Hodgson

Retrograde Transport
Video by Noah Sciaky

Migrating fibroblasts
Video by Feimo Shen